

Data visualization tool

Project overview
This project involved designing a web platform for a consulting firm of the energy sector, aimed at enhancing the efficiency and performance of energy traders managing and executing trades using capital from a proprietary trading firm (prop firm). In the fast-paced, high-frequency energy markets, traders need tools that allow them to make quick, data-driven decisions while managing risk effectively.
The platform was built to provide energy traders with advanced features that streamline trade execution, integrate real-time market data, and support automated trading strategies. By utilizing the prop firm’s capital, traders can take on larger, more profitable positions but must do so with careful risk management. This tool was designed to ensure they stay within the firm’s risk parameters while maximizing trading opportunities.
Key functionalities include real-time market analysis, automated trade execution, and risk management controls, helping traders optimize strategies and minimize potential losses. The client's involvement in the project ensured a high level of strategic insight and precision in crafting a solution that meets the complex demands of energy trading in volatile markets. This platform is a vital tool for prop traders, providing them with the resources they need to navigate and succeed in some of the most competitive and fast-moving financial markets.
The goal
The goal of this project is to develop a data visualization tool based on a data model provided by the client's Data Analysts.
My role
Product designer
Team
This project was implemented by myself as the sole member of the team.
Client
A consulting firm
of the energy sector*
*Due to NDA reasons this client
cannot be mentioned
Time
1 year
Main dashboard
The tool’s main navigation is organized using a sidebar.
Data is presented through sections that include charts and tables.
A content switcher allows users to switch between portfolios and view different datasets.

Portfolio
Users input data to configure the tool’s parameters through dedicated input fields.
They can also adjust the data display by using the content switcher.

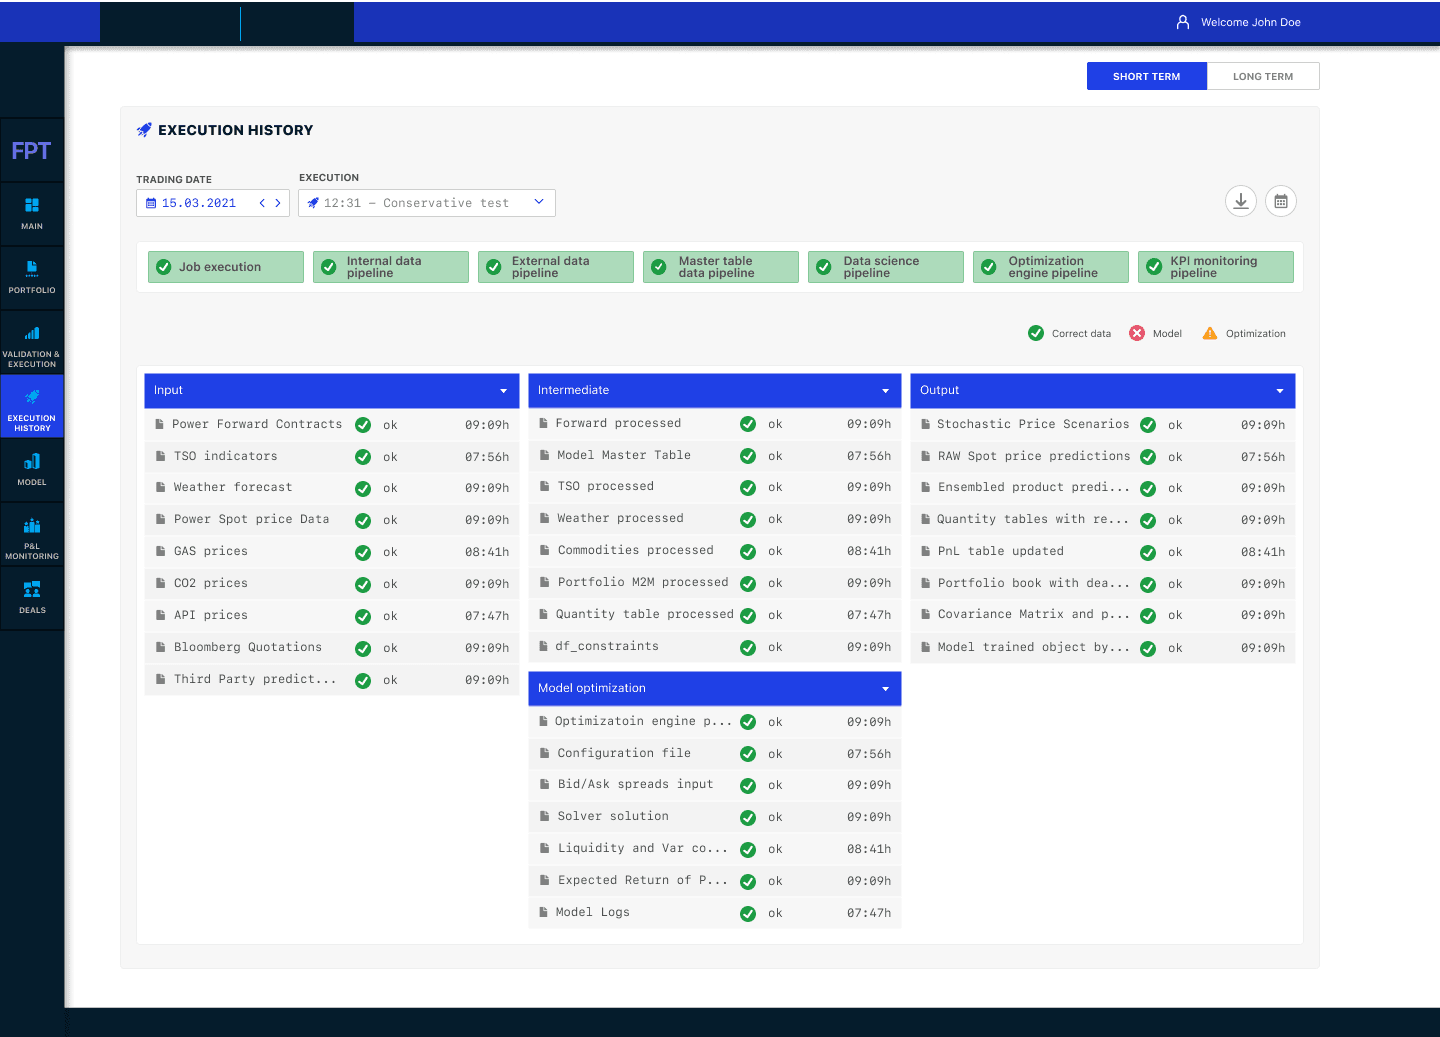
Model execution
The tool also enables users to upload, download, and modify the data model to improve prediction accuracy.
Showing results
The tool displays results in the P&L Monitoring section
